Authors: Gustavo Regnicoli, Andrea Reschini, Roberto Paz (R&G Telecomm Group)
Abstract:
When planning energy matrix transition to decrease carbon footprint, power consumption pattern is a critical topic to tackle. For human activities this is a very complex approach because disruptive production and consumption trends are needed. But in the Cable Landing Stations it is a must do, while technology evolves to suitable renewable energy solutions.
1. INTRODUCTION
We are living in a world that is transitioning in many matters. Perhaps humans -while evolving- have been always transitioning, but in the technology era transition is something concrete, spanning just some decades, possible from the idea itself and feasible from economics. One of those transitioning topics -if not the main one- is the energy matrix transition. Humans understood that we can’t keep using power sources that impact our atmosphere with greenhouse gases emissions. According to some calculations we impact with 51 billion CO2e tons per year[1], and this is directly related to global warming. That’s why there are so many goals for 2030, 2040 and 2050, setting a path to a world with net zero CO2e[2] emissions. At least, it seems to be a consensus that 2050 will be a non-returning point. Humans should agree on that and act accordingly
[1] Oxford Martin School – “Our World in Data”: Annual greenhouse gas emissions: how much do we emit each year? https://ourworldindata.org/greenhouse-gas-emissions.
[2] Carbon dioxide is the most dominant greenhouse gas emitted through fossil fuels burning, industrial production and land use. But it is not the only one: there are a bundle of gases that significantly contribute to global warming, all of which are quantified in one single equivalent metric expressed as “CO2e” or “CO2eq”.
Before focusing on power consumption in the Cable Landing Station, which in fact involves the cable system as a whole, let’s review which are the components and incidence of each human activity according to some authors, measured as how much greenhouse gas is emitted by each of them in percentage of the total (globally)[1]:
[1] Breakthrough Energy – “The five Grand Challenges” – World Economic Forum “Fostering Effective Energy Transition” 2022 Edition
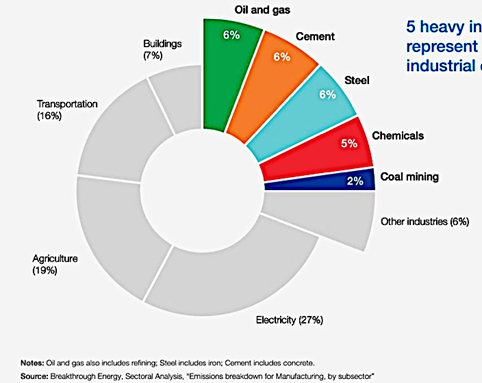
Fig. 1: Emissions breakdown, Sectorial Analysis
______________________________________________________________________________________________________________
[1] Oxford Martin School – “Our World in Data”: Annual greenhouse gas emissions: how much do we emit each year? https://ourworldindata.org/greenhouse-gas-emissions.
[1] Carbon dioxide is the most dominant greenhouse gas emitted through fossil fuels burning, industrial production and land use. But it is not the only one: there are a bundle of gases that significantly contribute to global warming, all of which are quantified in one single equivalent metric expressed as “CO2e” or “CO2eq”.
[1] Breakthrough Energy – “The five Grand Challenges” – World Economic Forum “Fostering Effective Energy Transition” 2022 Edition
_______________________________________________________________________________________________________________
So, telecom industries connected to “not-green” energies contribute to a 27% of the total of greenhouse gases effects.
At this point, any CLS manager could say: “sooner or later, our utility will transition or change, so finally we would be just right there, with clean or renewable energy. No need to perform any action, so we can keep our operation as it is.” So, it is necessary to analyse why CLS operation is concerned.
2. GREEN ENERGY CHALLENGES
According to current power generation technologies, options for clean energies[1] are Solar, Wind, Nuclear, low-scale Hydropower, Biomass, Geothermal and Marine, among others.
[1] While there are subtle differences between terms “renewable”, “clean” and “green” when referring to energy production, they each represent the future or our energy supply:
“Renewable” energy systems use natural resources as fuel, and replenish themselves over short periods, or never run out at all (e.g: solar, wind, hydro, geothermal, biomass).
“Green” energy is a subset of renewables, representing generation with the smallest environmental footprint. Large-scale hydropower can have an environmental impact due to its land use, effects on marine life and deforestation. So, it is considered “renewable” but not “green”.
“Clean” energy does not create any greenhouse gases during its production, although it is not necessarily renewable. Nuclear power is an example.

Fig. 2: IEA (International Energy Agency), Renewable annual net capacity additions, main and accelerated cases, 2015-2027 Licence: CC BY 4.0
In a comparison among different sources of electric power, concerning the amount of land or water required to deploy each kind (measured in watts per square meter), and according to current technologies, implementing a global full clean energy system equivalent to traditional ones is a great challenge from resources, planning and economy points of view. Moreover, it must be considered that traditional power plants are already built and in production. Nuclear and gas (hydrocarbons) are the most land-efficient energy sources nowadays, with 0.3 and 1 m² per MWh respectively. Next come solar
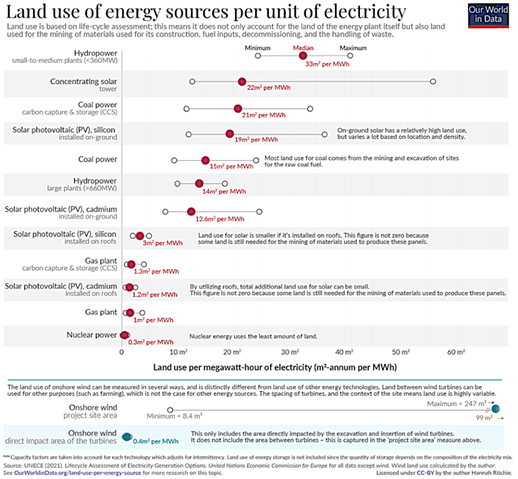
Fig. 3: Land use of energy sources – Our World in Data / UNECE (United Nations Economic Commission for Europe)
Another main factor to consider is storage. While traditional power systems are dispatchable on demand, the main renewable ones we are considering are intermittent: they require specific conditions that are nature ruled. That power needs to be saved somehow, and that’s another variable to consider on the economic equation. Lithium, hydrogen cells, and others to be developed are technology response, but not to be assumed like a solved problem. So, for all humans there’s a challenge to face when transitioning to clean energies: perhaps there’s no way to keep same power consumption profiles,
________________________________________________________________________________________________________________
[1] While there are subtle differences between terms “renewable”, “clean” and “green” when referring to energy production, they each represent the future or our energy supply:
“Renewable” energy systems use natural resources as fuel, and replenish themselves over short periods, or never run out at all (e.g: solar, wind, hydro, geothermal, biomass).
“Green” energy is a subset of renewables, representing generation with the smallest environmental footprint. Large-scale hydropower can have an environmental impact due to its land use, effects on marine life and deforestation. So, it is considered “renewable” but not “green”.
“Clean” energy does not create any greenhouse gases during its production, although it is not necessarily renewable. Nuclear power is an example.
________________________________________________________________________________________________________________
because building a full equivalent clean energy matrix system is not feasible in 30 years. And widening the angle to other topics, many CO2e impacting activities could be put on discussion. Examples: if agriculture and animals growing are responsible for some of 19% of the CO2e, it will be mandatory to change current production clues. Or if transport involves 16% it is necessary to put on discussion globalization and its long reach trade, as consuming things coming from remote locations makes no sense instead of consuming things from factories around our locations.
What about costs? Due to market problems around the world, energy became highly expensive and difficult to get. While planning a transition, these problems have two main impacts: 1) higher prices as a market tendency and 2) a big step back for transition efforts. As an example of this last point, while discussing and agreeing in 2021 how many coal plants needed to be closed to decrease this main impact in CO2 emissions, in 2022 due to international conflicts some old carbon plants were reopened for production [1]. And costs of energy are increasing monthly for houses and industries. So, in every community there’s a plan (or should be) to decrease power consumption and foster local energy generation.
In short:
- Cable Landing Stations use electric power that needs to be transitioned to renewable sources
- Renewable sources require assets (space, etc.), so optimizing power consumption will help to find a suitable solution from all perspectives
- Cable Landing Stations are placed in communities which are doing big efforts to decrease energy consumption. So, being members of that community, telcos should be part of -or lead- that effort [2]
- Community is also considering what habits and production trends need to be changed to meet CO2e goals. Again, CLS is part of and needs to join that effort putting under discussion traditional operational behaviors
- Energy is becoming an expensive resource worldwide. Any plan for optimizing power consumption will have a positive impact in terms of OPEX.
3. REDUCING POWER USAGE IN CABLE LANDING STATIONS
Traditional CLS components and typical percentages in their power consumption profile are:
| Tx equipment – (AC+DC) | 50% |
| Cooling System (AC) | 43% |
| Lighting, comfort, operation, surveillance (AC) | 3% |
| UPS, Transformer, Rectifier (AC) | 4% |
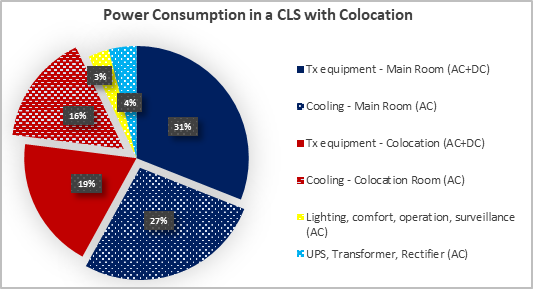
Fig. 4: Example of power consumption distribution in a traditional CLS with colocation
The core business and reason why a CLS exists are submarine dry plant equipment: PFE, amplifiers, transponders and all related, in first place. In second place, terrestrial optical, data equipment and servers. All these power consuming elements are “productive power” (or “payload power”), and it is the numeral value when calculating PUE indicator.[1]
How this telecom equipment can be more efficient is out of the scope of this document. Just two things to consider:
[1] PUE (Power Usage Effectiveness) is a ratio that describes how efficiently a computer data center or telecom facility uses energy.
[1] https://www.forbes.com/sites/juliecoleman/2022/07/08/germany-reopens-coal-plants-because-of-reduced-russian-energy/?sh=70acc6857350
[1] “Could Data Centers become an asset for energy systems?” https://www.iea.org/commentaries/data-centres-and-energy-from-global-headlines-to-local-headaches
[1] PUE (Power Usage Effectiveness) is a ratio that describes how efficiently a computer data center or telecom facility uses energy.
PUE = Total Facility Energy / IT Equipment Energy
There are standards, ratings and design criteria that indicate how efficient telecom equipment are, framed in TS102533, ITU L.1310, ATIS-0600015.03, EnergyStar, etc, so in the process of planning to use a new gear, they should be considered.
In the telecom technology evolution, it is critical -and amazing- how the rate Watts/Gigabit has been decreasing year after year thanks to integration.
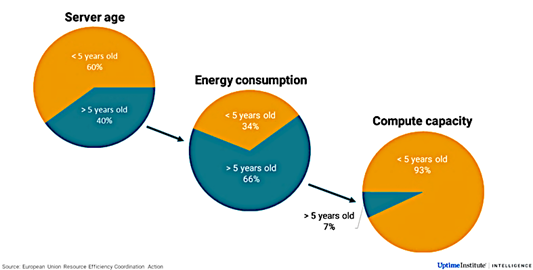
Fig. 5: Energy usage and compute capacity based on server age
So, for network planners it is important to understand that replacing old equipment will be a way to reduce power consumption. Also, it is an intelligent solution to solve some past years issues that are very complex to solve for CLS operation, as we’ll see later.
At this point, it’s clear that replacing old equipment means reducing power and space usage. A sustainable approach must also consider resources circularity in terms of equipment, components, and materials. [7]. A circuit for non-operational parts must be established, to always maximize their value, while minimizing waste.
Coming back to operational equipment, in addition to their electrical consumption, all these devices generate heat. How IT rooms in landing stations manage this heat according to their design will determine how much power will need to cool each device appropriately to the operational temperatures required. That is the core of an Energy Efficiency plan in a CLS.
When designing an IT room in the CLS, there are several considerations, but the main one is how many racks it will be able to support, and which power capacity, end of life. From that first input, some main others to define:
- Rack distribution and layout
- Type of floor and ceiling
- Air conditioning method and strategies
- Resulting thermal architecture
- Recommendations to follow during equipment installation to meet all rules related with design constrains
If we look back twenty or thirty years in the CLS design and operation, perhaps most of these items are in controversy, if not all. Many of the traditional CLS had design inputs that, when technology and businesses evolved along the years, became not the best option as originally planned. Let’s review some examples of these points as an appetizer to the plan:
Space cooling strategy: the typical architecture for HVACs is oriented to cool the room and not the devices. Perimetral T/H sensors for ambient adjustment. So, for normal conditions there might be some devices out of their thermal specification without cooling system notification
Overhead ducts or raised floor: Sometimes overhead ducts and diffusers distribution don’t fit with row final layout and then it is challenging for cold air to reach each equipment air intake. For underfloor cooling strategies, there was a usual methodology to also include cabling (electrical and optical). Therefore, airflow underneath finds obstacles in trays and ducts filled with cables that accumulated along the years and are very difficult to remove due to customer traffic risks
Hot and cold air mixing: Due to these design constrains, hot and cold air are mixed in the room, what generates a positive feedback effect producing higher temperatures at equipment output
Different equipment standards: If standards are not fully met and installations in the room respond to different strategies, there’s no way to keep hot and cold aisles architecture. In some regions like Latin America, the mixed use of ANSI and ETSI standards generate these kinds of problems regarding where hot air is exhausted, to the back or to the front, respectivelyType of racks and doors: same applies to racks standards. If equipment airflow strategy doesn’t match with racks design, the effect of heat accumulation is amplified and hard to be solved with air conditioning systems. This issue usually generates what is called “hot spots” in the room.
Different standards, same rack: installing different airflow strategy equipment in the same rack doesn’t allow to solve heat accumulation and normally hot air exhaust from one equipment finishes in the air intake of the other, generating an accumulative heat effect.
Space requirements: submarine dry plant gears in the 90s needed a high number of racks. In addition to PFE, old equipment had couplers, adders, amplifiers, and transponders. A typical initial installation could take six rack positions for a fiber pair. If CLS had to be planned for end of life, of course they were big rooms. But when technology evolved to fit same capacity or more in smaller space, and old 4 slots transponder became a pizza box with 100+ times capacity for example, some CLS found themselves with wide empty spaces, inconvenient for a thermal architecture.
More and more space: because of having available space, it became a good business to provide collocation, which at the same time collaborates with the mix of standards
It is important to mention that Cable Landing Stations had a quite different beginning and evolution than modern Data Centers. While those had an initial requirement to house submarine dry plant equipment and then had to evolve to support other more consuming devices, DC were born many years later to house big servers, and later other not so power demanding devices. That’s why it is a different context to analyze, but the tools and strategies to improve conditions will be the same at the end.
FIRST STATEMENTS:
At this point it is possible to understand the complexity of the problem CLS operation is facing. Although customer service and availability related activities are top priority, when reviewing all previous topics any top executive would consider “it is mandatory we do something”. Some considerations:
- These topics and issues are not part of the standard CLS operation. Assuming that will help to find resources and implement solutions
- An energy efficiency committee or department, with proper consulting and support, needs to take control of the plan, set priorities, and look for resources
- Funding is a problem as this is not CAPEX, neither OPEX: corporate decision to support initiatives is mandatory. Anyway, there are some projects that can be afforded with energy cost savings, considering a ROI of some years. In other cases, savings could be in the form of not expenses, like avoiding adding a new cooling equipment.
- Making a plan that starts with simplest issues will require less resources and, as soon as started, will show a path to a more sustainable CLS
How to attack a problem is the first step of a plan to solve it.
4. AN INITIAL VISIT TO ASSESS ENERGY SAVINGS POTENTIAL
During an initial Site Survey, the following topics will be explored:
- Analyze IT equipment air intake and exhaust, rack by rack. Document with arrows following a red/blue color code, in a rack layout scheme for each row
- Try to identify aisles according to hot/cold airflows. Also request floor plants and site documents to understand initial inputs and how CLS was designed
- Considering there’s a pattern, identify what equipment mismatch. If there is not a pattern for hot/cold aisles, it’s time to set one.
- Analyze each rack type and evaluate if it fits with the equipment layout and hot/cold airflow clue. Also check each door and mark those that need to be changed or removed.
- For non-fully populated racks, register how many blanking panels are needed, measured in number and rack units. Blanking panels will avoid hot and cold air mixing among aisles
- Identify all equipment that are in conflict regarding fan types (front/rear exhaust). Also note back-to-back installations per row
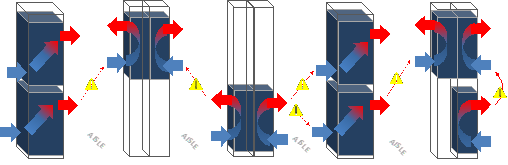
Fig. 6: Avoid thermal conflicts between IT equipment
- Mark hot spot devices, those that have a conflict with hot airflow coming from other equipment and their temperature raise out of standard value.
- Document conflicts between equipment into the same rack, in case hot airflows to intakes
- Record each rack temperature, both front and back, with thermometer or thermal pictures
- Survey HVAC system: type and specs, location, redundancy scheme, level of communication and intelligence implemented. Also check T/H sensor locations and readings.
- For raised-floor rooms, review if there are obstacles, how airflows reach perforated panels and if these are distributed according to rack layouts; also, what type of airflow panels and dampers are being used. In addition, investigate if there are leaks inside racks and grids where they are not needed and should be replaced by a non-perforated panel.
- In case of top air distribution through ductwork, correlate ducts and cold aisles layout in such a way that any misalignment can be highlighted, considering also diffusers locations. For each cold aisle, enumerate which diffusers correspond and how airflow reach it. Also, check what diffusers are inconveniently located so their grids must be closed or turned.
- Request information and review locations of dampers and if they are manual or automatic. For the case of downflow air distribution, check dampers in non-operating CRAC (Computer Room Air Conditioning) units. For top air distribution ductwork, dampers might be inserted between branches.
- Model and document hot air return to CRACs in the room. Identify if there are “cold air short circuits”: this happens when cold air is not reaching IT equipment, being incorrectly taken by CRACs intake
- Document also room building related matters: doors (type and locations), air leaks, lighting, thermal conditions, painting, rooftop, Building Management System scope, water pumping and heating, etc.
5. PLAN: IMPROVE WHAT IS WORKING AND CHANGE ONLY WHAT IS NOT
Elaborate or confirm cold/hot aisles architecture. Mark them whit a color code in case they are not labeled.
Change air exhaust orientations for the equipment that can do so. Register those that are also able to, but have a back-to-back configuration; also, equipment that are definitively bad installed regarding aisles architecture. Save them for later.
Determine which devices generate “hot spots” and why. Normally there’s an interaction with others that inflate hot air in their intake. Implement blocking solutions, or containment, to avoid this conflict case by case. If not possible, record this issue and save for later.
Remove every air blocking rack door. At some points those can be replaced, but meantime it is mandatory to take them away to progress in the plan. Also, every telecom equipment can be locked with its own cover. This is the most recommended solution.
Complete every empty row position with rigid panels or vinyl curtains, so cold/hot aisles can be physically isolated along the rows. Additionally, fill every open rack unit space with a blanking panel.
Design and implement containment. It can be hot or cold, depending on site architecture. But for traditional CLS configurations, cold containment is the preferable and usual solution.
Check that “cold air short-circuits” are blocked with proper containment or panels. It is mandatory that hot, not cold, air arrives to the CRACs intake for an efficient performance of the cooling system
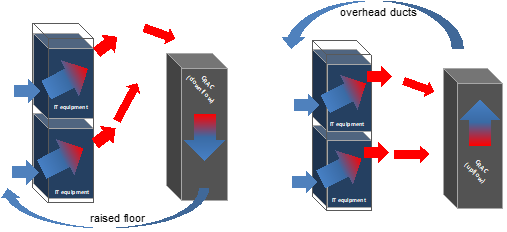
Fig. 7: Hot/cold airflows: “virtuous circles” among IT eqs and cooling sys.
For top duct air distribution, make sure each diffuser pushes cold air into aisles and containment. If the original design doesn’t allow that, a short elbow can be added to redirect airflow. Grids over hot aisles or in spaces without equipment must be closed or turned. All these modifications should be homologated to follow the original HVAC system design parameters.
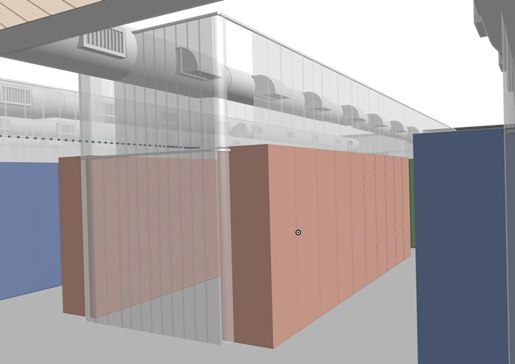
Fig. 8: Overhead air distribution, containment, elbows
In case of downflow systems, it is critical to install an appropriate airflow panel to each rack. The best option is to use adjustable and directional grids (blade dampers), which allow to directly convey airflows to each shelf in the rack (up/middle/below).
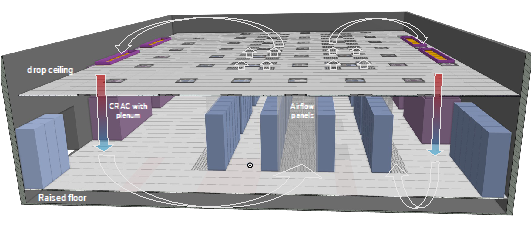
Fig. 9: Raised floor, drop ceiling, hot and cold aisles, airflow panels
Ensure hot air reaches CRACs intake avoiding or minimizing mixing with cold airflows. Options are to rise these intakes adding plenums or implementing a drop-ceiling so hot airflows through grids to CRACs directly.
Make sure to use grommets to block holes underneath racks utilized to pass cables, so no way for cold air to ascend inside the rack and forcing it to go through equipment air intake in front. In addition, it is mandatory to close every leak for cold air along the room floor and replace floor panels in areas where there is no equipment installed.
According to the model of CRACs, implement what is needed for them to work coordinately. If needed, install communication interfaces, and required software. It is possible in some models to configure a teamwork mode and algorithms to perform intelligent and efficiently.
Install T/H sensors to be also connected to CRAC units. These sensors are distributed along cold aisles sensing racks and allowing automatic adjustment to the system.
Implement variable speed drivers or EC fans, so speed can be regulated as by the system and save power better than being ON or OFF only.
Implement monitoring and advisory AI-based systems, with granular sensing at a rack level, and dynamically providing optimal cooling strategies plus planning most convenient placement for future equipment. Report to planning all components that were not able to be improved so those are included in future CAPEX/OPEX budgets to complete: telecom equipment (due to fan or physical matters or outdated); cooling system, rooms adaptations or reconfigurations, monitoring and control systems,
Ensure hot air reaches CRACs intake avoiding or minimizing mixing with cold airflows. Options are to rise these intakes adding plenums or implementing a drop-ceiling so hot airflows through grids to CRACs directly.
Make sure to use grommets to block holes underneath racks utilized to pass cables, so no way for cold air to ascend inside the rack and forcing it to go through equipment air intake in front. In addition, it is mandatory to close every leak for cold air along the room floor and replace floor panels in areas where there is no equipment installed.
According to the model of CRACs, implement what is needed for them to work coordinately. If needed, install communication interfaces, and required software. It is possible in some models to configure a teamwork mode and algorithms to perform intelligent and efficiently.
Install T/H sensors to be also connected to CRAC units. These sensors are distributed along cold aisles sensing racks and allowing automatic adjustment to the system.
Implement variable speed drivers or EC fans, so speed can be regulated as by the system and save power better than being ON or OFF only.
Implement monitoring and advisory AI-based systems, with granular sensing at a rack level, and dynamically providing optimal cooling strategies plus planning most convenient placement for future equipment.
Report to planning all components that were not able to be improved so those are included in future CAPEX/OPEX budgets to complete: telecom equipment (due to fan or physical matters or outdated); cooling system, rooms adaptations or reconfigurations, monitoring and control systems, etc. All these recommendations will help to have a coordinated program instead of a one-time action
And what outcomes can be expected from an Energy Efficiency plan in a traditional CLS? In 20-years old CLSs, it might be demonstrated that, even when capacity and services keep growing, relative total power consumption and PUE can decrease by 20-30%. It’s important to notice that power reduction can be achieved both in the infrastructure and IT portions, provided not only CRACs but also internal IT equipment fans have optimized their operation.

Fig. 10: Power metrics improvement after Energy Efficiency implementation
6. CONSIDER A PLAN FOR RENEWABLE ENERGY ONSITE GENERATION
This is a more complex, expensive, and challenging plan, but it will be the subsequent path to follow. It is difficult to find a 100% solution, but yes there are many options for initiatives: Depending on the CLS location, local legislation, incentives, and available space, there would be solar, wind or hybrid options to consider, to be deployed on premises. Normally they would cover a portion of the energy needed for full capacity, but that portion will be cleanly and free-of-charge “fueled”, thus independent of energy costs fluctuations. Deploying rooftop solar PV means taking advantage of the CLS existing roof (or to be built) as a resource for global distributed energy generation[1]. Additionally, solar panels can contribute to shading the roofs thus decreasing internal temperature
Renewable energy technologies are expected to evolve to a more efficient use of space and resources. Development of marine energies (wave, tidal, thermal, osmotic, etc.) is also worthy tracking and exploration.
7. CONCLUSIONS
There are several reasons why to set a concrete EE&S plan as part of CLS operation. How to do it makes a challenge, departing from simplest matters, with immediate results, to more complex and resources demanding solutions.
Submarine business actors should realize those reasons and set goals, as capacity growths Y2Y but power consuming problems and energy concerns do so.
Setting a concrete plan will allow this business segment to improve energy usage and generation in the short time and have a net zero CO2e impact long before 2050.
8. REFERENCES
- Uptime Institute, “Beyond PUE: Tackling IT’s wasted terawatts”, Pages 5-10.
- IEA (International Energy Agency), “Renewables 2022”, Paris. Chapter 1.
- World Economic Forum, “Fostering Effective Energy Transition” 2022 Edition, Ch 2 & 3.
- Bill Gates, “How to avoid a climate disaster”, Ch1, 2, 5.
- William McDonough, Michael Braungart, “The Upcycle: Beyond Sustainability – Designing for Abundance”, Ch 1, 2, 7.
- Ellen Mac Arthur Foundation, S. Rana and K. Brandt, “Circular Economy at work in Google Data Centers” – Case Study September 2016
[1] Environmental Defense Fund and Environment America: https://environmentamerica.org/resources/shining-rewards/ https://blogs.edf.org/energyexchange/2016/10/21/8-benefits-of-distributed-solar-that-prove-its-worth-more-than-dollars-and-cents/
________________________________________________________________________________________________________________